A profit margin tells you what percentage of your revenue you actually keep after paying costs. It is the single most direct measure of whether a business is genuinely profitable or just busy. Gross, operating, and net margin each reveal a different layer of financial health, and knowing which one to watch, and when, is what separates businesses that grow from those that stall.
What is a profit margin and why does it matter?
Profit margin is the proportion of revenue that remains as profit once relevant costs have been deducted, expressed as a percentage. That percentage framing is what makes it useful: unlike a raw profit figure, a margin lets you compare performance across different periods, different businesses, and different sizes of operation.
The distinction between profit margin and net profit is worth fixing clearly in your mind. Net profit is an absolute number, say £40,000. Profit margin is that same figure expressed as a share of revenue, so if revenue was £200,000, the net margin is 20%. Both matter, but the margin is what tells you whether the business model is working.
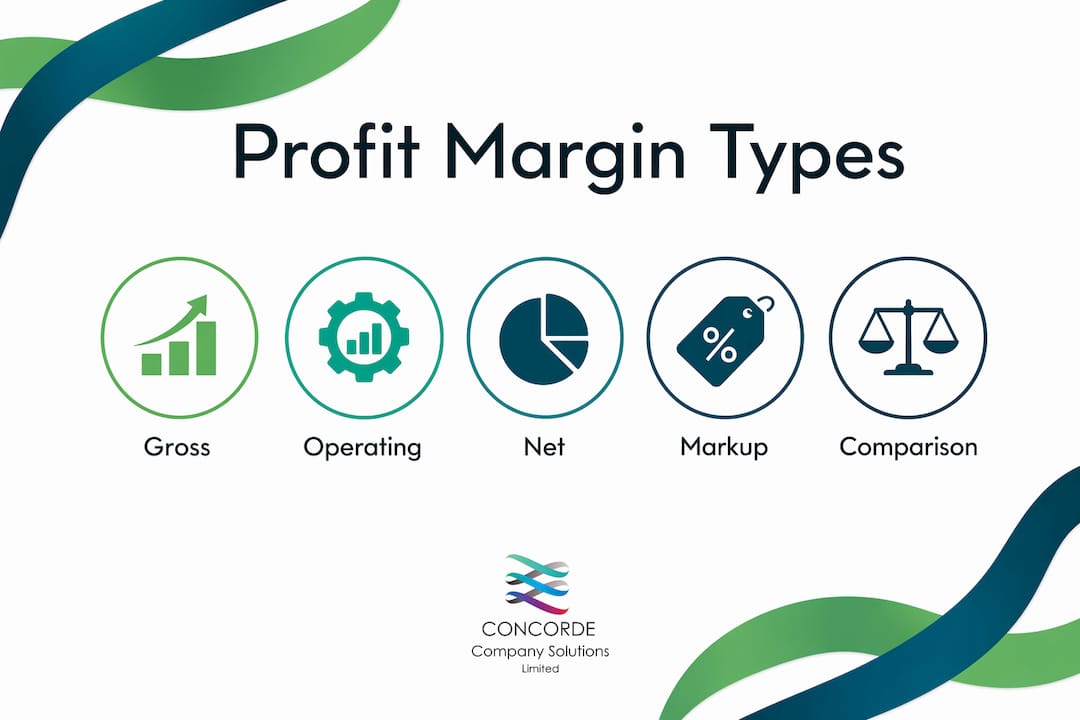
Three main types of profit margin exist, each stripping away a different set of costs:
- Gross profit margin: revenue minus the direct cost of producing goods or services
- Operating profit margin: gross profit minus overhead expenses such as rent, salaries, and utilities
- Net profit margin: what remains after every expense, including tax and interest, has been paid
Profit margins also serve as a compliance signal. HMRC uses the gross profit rate as one of its most common audit benchmarks, comparing a business’s margin against the prevailing rate for its sector. A margin that drifts well below the industry norm can trigger an enquiry, so monitoring yours is not just good practice; it is a form of regulatory protection.
The three types of profit margin: formulas and examples
Gross profit margin
Gross profit margin measures how efficiently a business converts revenue into profit after covering only its direct production costs, such as raw materials, manufacturing, and direct labour. It deliberately excludes overheads, which is why it can look flattering compared to the figures further down the income statement.

Formula: (Revenue – Cost of Goods Sold) ÷ Revenue × 100
Example: A Leeds-based manufacturer generates £500,000 in revenue. Its cost of goods sold is £300,000. Gross profit is £200,000, giving a gross margin of 40%.
Operating profit margin
Operating margin goes a step further by deducting all operating expenses: rent, utilities, salaries, and depreciation. It excludes interest payments and tax, so it reflects how well the core business runs before financing decisions come into play.

Formula: Operating Profit ÷ Revenue × 100
Example: Using the same manufacturer, operating expenses total £120,000. Operating profit is £80,000, giving an operating margin of 16%.
Net profit margin
Net profit margin is the bottom line. It accounts for every expense including taxes and interest, making it the truest picture of what the business actually earns for its owners.
Formula: Net Profit ÷ Revenue × 100
Example: After £20,000 in interest and £15,000 in corporation tax, net profit is £45,000. Net margin: 9%.
Profit margin vs markup: a common source of pricing errors
Confusing markup with profit margin is one of the most frequent mistakes in small business pricing. Markup is profit expressed as a percentage of cost. Margin is profit expressed as a percentage of selling price. A 50% markup on a £10 item gives a selling price of £15, but the profit margin on that sale is 33%, not 50%. Pricing based on markup alone, without checking the resulting margin, can quietly erode profitability.
| Metric | Formula | Example (£10 cost, £15 price) |
|---|---|---|
| Markup | Profit ÷ Cost × 100 | £5 ÷ £10 × 100 = 50% |
| Profit margin | Profit ÷ Revenue × 100 | £5 ÷ £15 × 100 = 33% |
Pro Tip: Always sense-check your pricing by calculating the resulting profit margin, not just the markup. A 50% markup sounds healthy until you realise the margin is only 33% and your overheads are eating half of that.
What counts as a good profit margin in the UK?
A good profit margin depends entirely on your sector, your business’s age, and the economic conditions you are operating in. A 5% net margin is considered thin in software but perfectly respectable in food retail, where volumes are high and competition is fierce. HMRC’s own benchmarking guidance makes this explicit: realistic performance assessment requires comparing against sector-specific norms, not a universal standard.
The table below presents qualitative ranges of profit margins across common UK sectors. These approximate averages reflect typical sector conditions but vary widely by business size, location, and model.
Newer businesses typically run lower margins as they build customer bases and absorb start-up costs. A five-year-old professional services firm with a 20% net margin is in a very different position from a start-up posting the same figure while still investing heavily in growth. Context is everything.
One pattern worth watching: high gross margins paired with low net margins often point to overhead bloat or debt costs rather than a weak product. If your gross margin looks healthy but your net margin is thin, the problem is almost certainly sitting in your fixed costs or your financing structure, not your pricing.
Why profit margins matter for business success and growth
Tracking profit margins does more than confirm whether a business is profitable. It gives you the information to act on problems before they become crises.
Profit margins signal financial health, guide pricing and cost decisions, shape investor perception, and reflect how efficiently the business runs day to day. That is a lot of diagnostic power from a single percentage. Here is what each benefit looks like in practice:
- Financial health monitoring: a margin that shrinks quarter on quarter is a warning sign, even if absolute profit is rising, because it means costs are growing faster than revenue
- Pricing strategy: knowing your margin at each product or service level lets you identify which lines are worth promoting and which are quietly draining resources
- Investor and lender appeal: investors use net margin trends to assess management quality; a business with stable or improving margins is far easier to fund
- Cost management: margin analysis reveals which products or services deliver the best returns, so you can redirect spending without harming growth
- Business valuation: acquirers and investors typically apply a multiple to EBITDA (earnings before interest, tax, depreciation, and amortisation), which is closely related to operating margin; a higher, stable margin directly increases what your business is worth
HMRC also tracks net profitability to turnover over time as part of its audit process. As HMRC’s own guidance notes, a decline in net margins alongside rising turnover is a red flag, suggesting that additional commercial risk is being taken for little financial reward.
Profit margin analysis has real limits, though. A margin figure without context can mislead. A retailer with a 3% net margin and £10 million in revenue is generating £300,000 in profit; a consultancy with a 30% net margin and £100,000 in revenue is generating £30,000. Margin alone does not tell you the full story of a business’s scale or cash position. For a fuller picture, profit and loss analysis alongside cash flow monitoring gives you both the efficiency metric and the liquidity view.
Expert insights from Concorde Company Solutions on managing profit margins
Profit margin is a diagnostic tool, not just a calculation. That distinction matters most when margins start moving in unexpected directions.
Concorde Company Solutions Limited, the leading accounting firm in Garforth, Leeds, works with local SMEs across West Yorkshire to do exactly this kind of margin analysis. One pattern the team sees repeatedly: businesses with healthy gross margins but thin net margins that have never properly audited their fixed costs. Subscriptions, software licences, and admin overhead accumulate quietly. A structured cost review often reveals overhead inefficiencies that, once addressed, can meaningfully shift the net margin without touching pricing at all.
Pro Tip: List every fixed cost your business pays monthly, including software, insurance, and professional fees. Then ask whether each one directly supports revenue generation. Costs that do not should be renegotiated or cut. This single exercise often improves net margin faster than any pricing change.
For UK SMEs, transparent pricing and tailored financial planning are the two levers that most reliably protect margins over time. Transparent pricing means you know exactly what your accounting and compliance costs are, with no surprises. Tailored planning means your tax strategy, payroll structure, and bookkeeping are aligned to your actual business model, not a generic template.
Concorde Company Solutions Limited brings bespoke support to businesses in Garforth and across Leeds, covering everything from bookkeeping and payroll management to tax strategy and statutory accounts. For business owners who want to understand their margins properly and act on what they find, that kind of hands-on local expertise makes a genuine difference. Businesses looking to reduce operating costs alongside margin analysis will find the two disciplines reinforce each other directly.

What profit margin trends over time actually tell you
A single margin figure is a snapshot. A series of them is a story, and the story is usually more useful than any individual data point.
A business whose gross margin holds steady at 45% while its net margin falls from 18% to 11% over three years is not suffering from a sales problem. The revenue engine is working. The issue is cost creep in the middle of the income statement: overheads, debt servicing, or both. This is precisely the pattern that HMRC flags when reviewing accounts over multiple years, and it is the same pattern that signals to investors that management has lost control of the cost base.
Conversely, a business that shows improving net margins alongside flat or modest revenue growth is demonstrating something valuable: it is getting more efficient. That trajectory tends to attract better financing terms and higher valuation multiples, because it suggests the business model is maturing rather than just scaling.
Seasonal businesses present a particular challenge for margin trend analysis. A hospitality business might post a 15% net margin in summer and a negative margin in January and February. Averaging across the full year gives a more honest picture than any single quarter, and comparing year-on-year averages reveals whether the underlying trend is improving. Monitoring cash flow alongside margin trends is especially important here, since a profitable annual margin can coexist with serious short-term liquidity pressure.
The most useful habit is simple: review your three margin figures (gross, operating, net) at the end of every quarter, plot them against the same quarter in the previous year, and ask what changed. If gross margin held but operating margin fell, look at your overhead line. If operating margin held but net margin fell, check your interest costs and tax position. The answer is almost always in the gap between two adjacent margins.
Key takeaways
Profit margin is the most direct measure of business efficiency: it tells you not just whether you are profitable, but how profitably you convert each pound of revenue into earnings.
| Point | Details |
|---|---|
| Three distinct margin types | Gross, operating, and net margins each strip away different costs, revealing different layers of business performance. |
| Margin vs markup | Markup is profit as a percentage of cost; margin is profit as a percentage of selling price. Confusing the two causes pricing errors. |
| Sector context is everything | A 5% net margin is thin in software but normal in food retail; always benchmark against your own sector. |
| Trend analysis beats snapshots | A falling net margin alongside a stable gross margin signals overhead or debt problems, not a sales failure. |
| Fixed cost audits move the needle | Reviewing and cutting non-revenue-generating fixed costs often improves net margin faster than a price increase. |
No responses yet